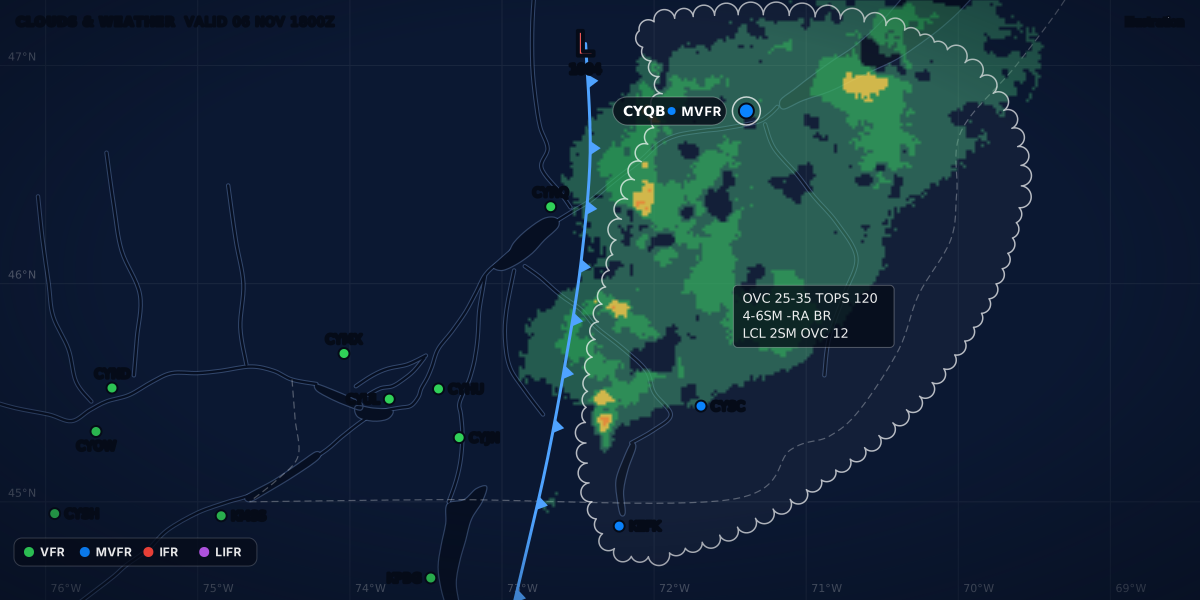
CLOUDS & WEATHER VALID 04 NOV 1800Z
Illustration
GFA: how to read NAV CANADA's Graphic Area Forecast
Read the Canadian GFA panel by panel: clouds and weather, icing, turbulence and freezing level, the IFR outlook, heights ASL, and what ISOL, OCNL and FRQ mean.
 Jp Valery
15 min read
The graphic area forecast (GFA) is NAV CANADA’s forecast for the air between aerodromes. A METAR and a TAF describe one field. The GFA is a set of weather charts for a whole region, at or below 24,000 ft. Transport Canada says it is “primarily designed to meet general aviation and regional airline requirements for pre-flight planning in Canada” (TC AIM MET 4.1). It is the area forecast in the map of aviation weather products.
Here is one area of a clouds and weather chart, decoded. It is a real-format example for southern Québec, valid 04 NOV at 1800Z. It is constructed, not a real forecast. On the chart, a scalloped line encloses the area, and the label sits inside it:
BKN 100
    ---
     30
4-6SM -RA BR
PTCHY 2SM -RA BR
CIGS 10-15 AGL| Part | Meaning |
|---|---|
BKN inside a scalloped line |
An organized area of broken cloud (MET 4.11) |
100 over 30 |
Tops at 10,000 ft and base at 3,000 ft, both above sea level. Heights are in hundreds of feet. |
4-6SM -RA BR |
Visibility 4 to 6 statute miles in light rain and mist |
PTCHY 2SM -RA BR |
In patches, over 26 to 50 % of the area: visibility 2 SM in light rain and mist |
CIGS 10-15 AGL |
In those patches, ceilings of 1,000 to 1,500 ft above the ground |
The TC AIM’s own sample chart labels an area in the same order: BKN 60/30, P6SM, PTCHY 2SM -SN, CIGS 6 AGL (MET 4.11, Figure 4.4(a)).
At the same time, Montréal / St-Hubert (CYHU), inside that area, reports this. It is also a real-format example, not a real report:
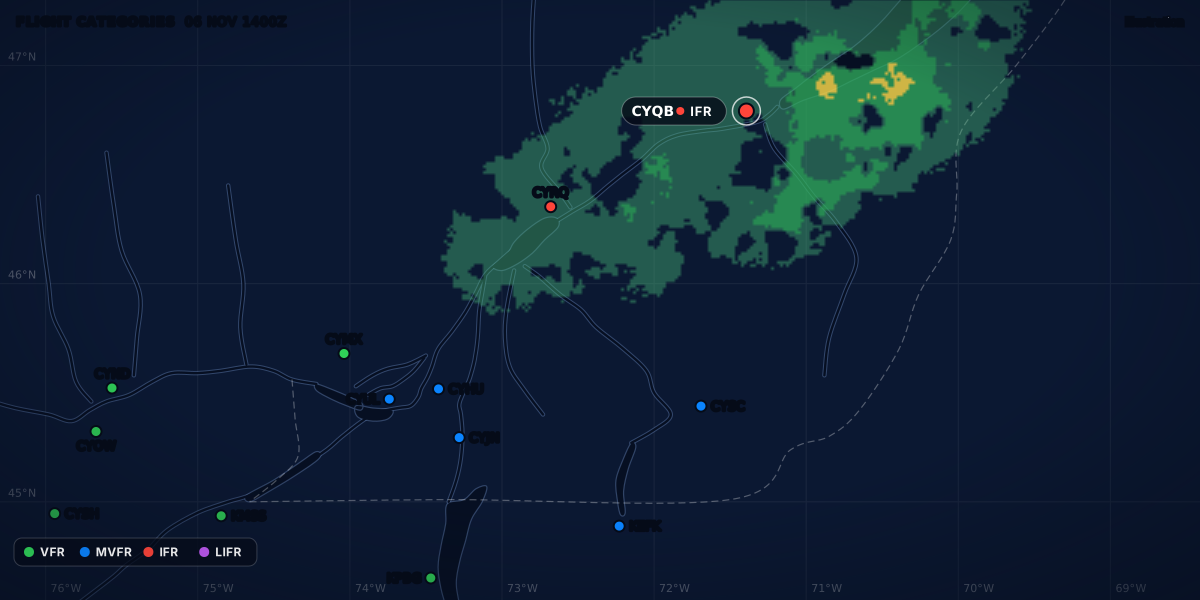
A visibility of 2 SM and a ceiling of 1,200 ft above the ground: CYHU sits under one of the patches. The visibility makes the category IFR. The GFA told you how bad the patches would be and how much of the area they would cover. It could not tell you which fields they would sit over at 1800Z. The METAR does. The category is a summary, the minimums are the law: see flight categories.
What the GFA is and where to open it
Seven GFA regions cover the whole Canadian domestic airspace (TC AIM MET 4.3). Each region has its own chart set (MET 1.3.6). The region for Ontario and Québec is GFACN33 (MET 4.7). Each issue has two kinds of chart (MET 4.2, 4.11 and 4.12):
- Clouds and weather: cloud, visibility, weather, fronts and pressure systems.
- Icing, turbulence and freezing level: icing, turbulence, the freezing level and the low-level jet.
To open it, use CFPS, NAV CANADA’s flight planning and aviation weather website at plan.navcanada.ca. It offers aviation weather products, NOTAM and flight plan filing (TC AIM MET 1.1.3). You can also call a flight information centre (FIC): its specialists can display the full range of weather charts and interpret them for you (MET 1.1.3). The CFPS guide gives the steps and the phone numbers.
The TC AIM’s list of flight weather documentation starts with “the relevant GFAs”, then AIRMETs, SIGMETs, TAFs, METARs, SPECIs, PIREPs and upper winds (MET 1.2.2). A TAF exists only for an aerodrome with METAR and SPECI reports (MET 1.3.3). I fly from two fields with no weather report, CSE4 and CSB3, so the GFA is the forecast that covers them. Weather without a METAR lists the other sources for a field like that.
ClearMETAR does not draw the GFA. For a Canadian airport, its station screen has a “NOTAMs and GFA” link that opens CFPS. The app covers the station layer that you check after the GFA: it decodes the METAR and the TAF and shows the flight category.
Issue times and validity
The GFA is issued four times a day, about 30 minutes before its forecast period starts (TC AIM MET 4.2). Each issue has six charts: a clouds and weather chart and an icing, turbulence and freezing level chart at the start of the period, 6 hours into it and 12 hours into it. The last clouds and weather chart adds an IFR outlook for 12 more hours.
| Issued at about | Charts valid at | IFR outlook |
|---|---|---|
| 2330Z | 0000Z, 0600Z, 1200Z | 1200Z to 0000Z |
| 0530Z | 0600Z, 1200Z, 1800Z | 1800Z to 0600Z |
| 1130Z | 1200Z, 1800Z, 0000Z | 0000Z to 1200Z |
| 1730Z | 1800Z, 0000Z, 0600Z | 0600Z to 1800Z |
MET 4.2 gives the issue times and the start of each period. The other times are computed from them. Each new set of charts replaces the one before (MET 3.1, Table 3.1). All GFA times are UTC (MET 4.4). In Montréal in winter (EST, UTC − 5), the 1730Z issue comes out at about 12:30 local time.
Between two charts. Each chart is a snapshot of one time. It does not show the changes between charts unless it says so. For a time in between, move the fronts and lows yourself. Each 5 kt of motion moves a feature 30 NM in six hours, and the scale bar in the legend helps you measure (MET 4.2). In the TC AIM’s example, a low moves east at 15 kt (MET 4.11): 90 NM in six hours, 45 NM in three (computed).
Convective cloud, morning fog and stratus often depend on the time, and a snapshot does not show those changes. Before you use a GFA, check the latest observations nearby, the comments on the chart and any AIRMET that amended it. When in doubt, get a pre-flight briefing (MET 4.2).
The layout: title, legend, comments
Every GFA chart has four parts: a title box, a legend box, a comments box and the weather information, which is the map itself (TC AIM MET 4.6).
Title box. It is in the upper right corner. It gives the chart name, the issuing office, the region, the chart type, the issue time and the valid time (MET 4.7). Here is the sample in TC AIM MET 4.7, Table 4.2 (a 2014 chart):
GFACN33 CWAO REGION
ONTARIO–QUÉBEC
CLOUDS AND WEATHER   NUAGES ET TEMPS
ISSUED AT / ÉMIS A   17/09/2014 1130Z
VLD 18/09/2014 0000ZGFACN33: the Ontario–Québec region.CWAO: the issuing office, the Canadian Meteorological Centre Network Operations in Montréal.17/09/2014 1130Z: issued on September 17, 2014, at 1130 UTC. Dates are day, month, year.VLD 18/09/2014 0000Z: valid at 0000 UTC on September 18.
All six charts of one issue show the same issue time. The valid time tells you which one you have. This issue started at 1200Z, so a chart valid at 0000Z the next day is the 12-hour chart (computed). As a clouds and weather chart, it is the one with the IFR outlook.
Legend box. It shows the weather symbols that the chart may use, such as thunderstorm, ice pellets, freezing rain and freezing drizzle, in red when the chart is in colour. It also has a scale bar in nautical miles (MET 4.8).
Comments box. The forecaster writes here what is important, such as fog forming or dissipating or visibility getting better or worse. The box also holds what is hard to draw or would clutter the map, such as light icing (MET 4.9). It also carries three standard phrases:
| Phrase | Meaning |
|---|---|
HGT ASL UNLESS NOTED |
Heights are above sea level, unless the chart says otherwise. |
CB TCU AND ACC IMPLY SIG TURB AND ICE. |
Cumulonimbus, towering cumulus and altocumulus castellanus imply significant turbulence and icing. |
CB IMPLIES L LVL WS |
Cumulonimbus implies low-level wind shear. |
The phrases are in MET 4.9. ACC is altocumulus castellanus in the TC AIM’s list of forecast abbreviations (MET 15.0).
Clouds and weather chart
This chart gives the forecast cloud layers, visibility, weather and obstructions to vision at its valid time. It also draws isobars every 4 hPa from 1,000 hPa, and the fronts and pressure centres with their motion (TC AIM MET 4.11).
Cloud. The chart gives the bases and tops of cloud from the surface to 24,000 ft ASL. It gives the tops of convective cloud (TCU, ACC, CB) even above 24,000 ft. It does not show cirrus. It always names CU, TCU, ACC and CB when they are forecast (MET 4.11). The top sits above the base, like a fraction. These labels are the TC AIM’s own examples, written here on one line:
| Label | Meaning | Border |
|---|---|---|
BKN CU 80/20 |
Broken cumulus, base 2,000 ft, tops 8,000 ft ASL | Scalloped: an organized area of BKN or OVC cloud |
SCT 50/30 |
Scattered cloud, base 3,000 ft, tops 5,000 ft ASL | None: unorganized cloud with visibility above 6 SM is given as SKC, FEW or SCT |
OVC 130/100, then SCT CU 50/30 |
Two layers 2,000 ft or more apart: each one gets its own amount, base and tops | Scalloped |
... LYRS |
Layers less than 2,000 ft apart: one amount for all of them together, then LYRS |
Scalloped if the amount is BKN or OVC |
LCA CIGS 3-5 AGL |
Local obscured ceilings, vertical visibility 300 to 500 ft above the ground | — |
The scalloped line is brown when the chart is in colour (MET 4.11). For what counts as a ceiling, see what is a ceiling.
Visibility and weather. Visibility is in statute miles. P6SM means more than 6 SM, and 2-4SM -SHSN means 2 to 4 SM in light snow showers. The weather always comes right after the visibility. Obstructions to vision, such as mist or haze, are given only when the visibility is 6 SM or less (MET 4.11). In colour:
- Showery or intermittent precipitation: hatched, inside a dashed green line.
- Continuous precipitation: stippled, inside a solid green line.
- Low visibility with no precipitation (6 SM or less): inside a dashed orange line.
- Freezing precipitation: in red, inside a solid red line.
Surface wind. The chart shows a wind barb and a speed when the sustained wind is at least 20 kt. The forecaster may add a weaker wind with strong gusts when the gusts should cause moderate mechanical turbulence. G35 means gusts to 35 kt. The TC AIM’s example is a wind from 270° true at 25 kt (MET 4.11).
Fronts and lows. An arrow and a speed give the motion of each feature that moves at 5 kt or more. STNR (stationary) means less than 5 kt (MET 4.11).
Icing, turbulence and freezing level chart
This chart shows the forecast icing and turbulence, with their type, intensity, bases and tops, and the freezing level. It also draws the fronts and pressure centres. Read it together with the clouds and weather chart for the same valid time (TC AIM MET 4.12).
| Element | How the chart shows it | Heights | TC AIM example |
|---|---|---|---|
| Icing | In blue, when moderate or severe icing is forecast. The type is RIME, MX (mixed) or CLR (clear). Denser stippling means severe. Light icing goes in the comments box. |
ASL | MX with 130/20: moderate mixed icing from 2,000 to 13,000 ft |
| Turbulence | In red, when moderate or severe turbulence is forecast. The cause is MECH, L LVL WS, LEE WV, L LVL JET or CAT. Denser hatching means severe. |
ASL, but surface-based turbulence is AGL | CAT 260/180: moderate clear air turbulence from 18,000 to 26,000 ft. MECH with 30 AGL over SFC: from the surface to 3,000 ft above the ground. |
| Freezing level | Dashed lines, to the nearest 2,500 ft: SFC, 25, 50, 75, 100 |
ASL | FZLVL 20 LOWERING TO SFC AFT 03Z in the comments box: 2,000 ft, down to the surface after 0300Z |
| Above-freezing layer | A closed area marked AFL |
ASL | AFL with 50/30 |
| Low-level jet | An arrow with L LVL JET and the maximum speed. Shown when the core reaches 50 kt or more. It may be shown at 35 to 45 kt when significant turbulence or shear is expected. Usually not shown above 6,000 ft ASL, except over higher terrain. |
Not given | L LVL JET 60 KT |
The rules and examples are in MET 4.12; the heights are computed from the labels. Two more rules from the same section:
- If icing is expected for only part of the period, the comments box gives the time.
- When there is more than one freezing level, the chart shows only the lowest one, unless the others matter for safety, for example with freezing precipitation aloft.
The IFR outlook
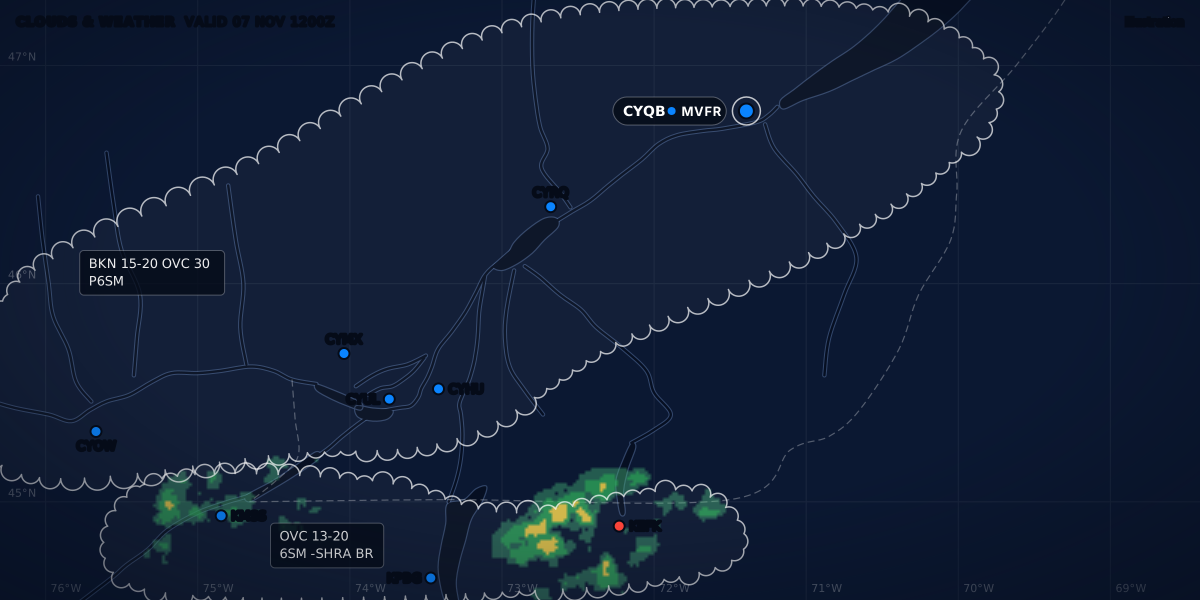
The IFR outlook is in the lower part of the comments box of the 12-hour clouds and weather chart. It covers the 12 hours after that chart (TC AIM MET 4.2, 4.9). It is “always general in nature”: it gives the main areas of IFR weather, the cause and the hazards. Here is the TC AIM’s example, from the bottom of its sample comments box (MET 4.9, Figure 4.3):
----- IFR OTLK -----
VALID: 12-24Z. 22 MAY/MAI 2024
CIGS/VIS RA BR SERN BC.
It forecasts IFR from 1200Z to 2400Z on May 22, 2024, over southeastern British Columbia, caused by low ceilings and low visibility in rain (RA) and mist (BR) (MET 4.9). An outlook valid 12-24Z comes with the 2330Z issue (computed from MET 4.2).
The outlook uses these criteria (MET 4.9, Table 4.3):
| Category | Ceiling | Visibility | |
|---|---|---|---|
| IFR | less than 1,000 ft AGL | and/or | less than 3 SM |
| MVFR | 1,000 to 3,000 ft AGL | and/or | 3 to 5 SM |
| VFR | more than 3,000 ft AGL | and | more than 5 SM |
Only IFR goes into the outlook. MVFR is in the table “for reference only”. If no organized IFR weather is expected, the outlook says NIL SIG WX (MET 4.9). Note that these ceilings are above ground, like a METAR’s. The US Aviation Weather Center uses the same MVFR and VFR limits, and splits IFR in two: below 500 ft or 1 mile, it is LIFR (AWC GFA help).
Coverage words: ISOL, OCNL, FRQ; LCA, PTCHY, XTNSV
A GFA area is large. A coverage word says how much of it the weather covers (TC AIM MET 4.11, Tables 4.4 and 4.5):
| Share of the area | Convective clouds and showers | Non-convective weather |
|---|---|---|
| 25 % or less | ISOL (isolated) |
LCA (local) |
| 26 to 50 % | OCNL (occasional) |
PTCHY (patchy) |
| More than 50 % | FRQ (frequent) |
XTNSV (extensive) or INTMT (intermittent) |
The non-convective words apply to cloud and precipitation that is not convective, low stratus and precipitation ceilings, icing, turbulence and low visibility (Table 4.5). So OCNL TCU covers 26 to 50 % of the area. LCA CIGS 3-5 AGL covers a quarter of it or less.
Same words, different numbers in France. Météo-France’s TEMSI charts use the same words for CB and TCU with other limits: ISOL less than 50 % of the area, OCNL 50 to 75 %, FRQ more than 75 % (Météo-France, Guide aviation 2024, p. 8). CB over 40 % of an area is OCNL on a GFA and ISOL on a TEMSI (computed).
Heights: ASL unless marked AGL
This is the trap of the GFA. TC AIM MET 1.2.2 says it plainly: “Heights in METARs and TAFs are always stated as height above ground level. On the other hand, heights in GFAs and PIREPs are normally stated as height above sea level, since terrain heights are variable over the larger area covered.”
| On the GFA | Reference | Section |
|---|---|---|
| Cloud bases and tops | ASL | MET 4.4, 4.11 |
CIGS ... AGL |
AGL | MET 4.11 |
| Vertical visibility in a surface-based layer | AGL | MET 4.11 |
| Icing bases and tops, freezing level | ASL | MET 4.12 |
| Turbulence | ASL; surface-based turbulence AGL | MET 4.12 |
| Low-level jet | No height given | MET 4.12 |
All heights are in hundreds of feet: “2 means 200 ft, 45 means 4 500 ft” (MET 4.11). Above-ground cloud heights are marked with CIG and AGL, as in CIGS 5-10 AGL, and the comments box carries HGT ASL UNLESS NOTED (MET 4.9, 4.11). MET 1.2.2 adds: “If heights are not ASL in GFAs, this is always highlighted by statements such as ‘CIGS 2-4 AGL.’”
To compare a GFA base with your field, subtract the elevation. With hypothetical numbers: a base of 30 (3,000 ft ASL) is 1,800 ft above a field at 1,200 ft, and only 500 ft above hills at 2,500 ft (computed). The same base over a field near sea level is close to 3,000 ft above it. PIREP heights are normally above sea level too (MET 1.2.2).
Amendments by AIRMET and SIGMET
Once issued, a SIGMET or AIRMET “automatically amends the current and relevant graphic area forecast (GFA)”, and the remark (RMK) in the national version of the message names the GFA region or regions (TC AIM MET 4.13). So the charts alone can be out of date: AIRMET vs SIGMET explains both warnings.
A correction is different: it is a new issue of the chart. A correction is issued when (MET 4.14):
- weather that was not forecast occurs and does not need an AIRMET, or the forecaster thinks it should be on the GFA;
- forecast weather fails to occur, so it is removed;
- the chart has a significant error: one that would lead to a wrong reading of the GFA and a potential hazard.
The title box then shows CCA for the first correction, CCB for the second, and so on. The comments box says what changed (MET 4.14). In the TC AIM’s example, the title box reads GFACN33 CWAO CCA, issued at 1211Z, for the chart valid at 1200Z (Table 4.6).
In the US, “GFA” is a different product
In the United States, GFA means the Graphical Forecasts for Aviation, a web page of the NOAA Aviation Weather Center (AWC). It is an interactive map, not a fixed set of charts, meant “to give users a complete picture of the weather that may impact flight in the United States (including Alaska & Hawaii), the Gulf and Caribbean, and portions of the Atlantic and Pacific Oceans” (AWC GFA help). The National Weather Service built it to replace the text area forecast, which ended for the lower 48 states on October 10, 2017 (SCN 17-89).
| NAV CANADA GFA | AWC GFA (US) | |
|---|---|---|
| What it is | Six fixed charts per issue, four issues a day (TC AIM MET 4.2) | An interactive map: you choose the layer, the level and the time |
| Area | Seven regions over Canadian domestic airspace (MET 4.3) | The US with Alaska and Hawaii, the Gulf and Caribbean, parts of the Atlantic and Pacific |
| Time | Snapshots at 0, 6 and 12 hours, plus a 12-hour IFR outlook | From 18 hours in the past to 18 hours in the future |
| Cloud heights | ASL unless marked AGL (MET 4.4) | MSL; the ceiling grids are AGL |
| Flight categories | IFR in the outlook, with MVFR for reference (MET 4.9) | Flight-category grids: MVFR, IFR and LIFR in colour, VFR left clear |
| Warnings | An AIRMET or SIGMET amends it (MET 4.13) | SIGMET, G-AIRMET and Center Weather Advisory in the Products menu |
The US column is from the AWC GFA help. One current limit: as of March 2026, the model behind the turbulence and icing layers over the lower 48 states has updated guidance only to forecast hour 16, so hours 17 and 18 repeat hour 16 (AWC GFA help).
Next: how the AIRMET and SIGMET amend the forecast, or how to brief on CFPS.
Sources
- TC AIM (TP 14371E) 2026-2, MET 1.1.3, 1.2.2, 1.3.3, 1.3.6, 3.1 (Table 3.1), 4.0-4.14 (graphic area forecasts) and 15.0 (abbreviations), Transport Canada
- GFA help: Graphical Forecasts for Aviation, NOAA Aviation Weather Center
- Service Change Notice 17-89: termination of the CONUS Aviation Area Forecast (effective October 10, 2017), National Weather Service
- Guide aviation 2024, p. 8: TEMSI abbreviations for CB and TCU (ISOL, OCNL, FRQ), Météo-France
Rules checked on
Common questions
Are GFA heights AGL or ASL?
Above sea level, unless the chart says otherwise: TC AIM MET 4.4 says all GFA heights are ASL unless otherwise noted, and above-ground heights carry CIG and AGL, as in CIGS 5-10 AGL (MET 4.11). METAR and TAF heights are always above ground (MET 1.2.2).
How often is the GFA issued?
Four times a day, at about 2330, 0530, 1130 and 1730 UTC, valid from 0000, 0600, 1200 and 1800 UTC (TC AIM MET 4.2). Each issue has six charts that cover 12 hours, plus an IFR outlook for 12 more hours.
What do ISOL, OCNL and FRQ mean on a GFA?
They give how much of the area convective clouds and showers cover: ISOL 25 % or less, OCNL 26 to 50 %, FRQ more than 50 % (TC AIM MET 4.11, Table 4.4). LCA, PTCHY and XTNSV or INTMT use the same steps for non-convective weather (Table 4.5).
Let the app do the decoding.
ClearMETAR turns every METAR and TAF into one plain sentence. Free on iPhone.